As we approach the end of the year, we’ll be covering trends from 22 key markets. We’ll recap what each industry has experienced over the past year and what to watch for in 2022. Learn who are the top advertisers from each category and how they spend across formats.
The value of the beauty market grew from $483 billion in 2020 to $511 billion in 2021, with an annual compounded growth rate of 4.75% worldwide.
Though supply chain issues and inflation pose a challenge for companies, especially considering most cosmetics shopping is now done online, industry leaders feel optimistic about recovery and long term growth.
“We’ve bucked the overall [mass cosmetics] category trend last year when the category was way down; we delivered strong growth,” said Tarang Amin, E.l.f. Beauty CEO. “The biggest [concern] is: When will consumers fully come back? I’m bullish on the category long term, because it’s such an important category for self-expression.”
The cosmetic industry has reinforced the adage that it’s recession-proof. Who should you prepare to pitch to as we enter 2022?

MediaRadar Insights
Overall Spending and Breakdown Across Formats
Beauty advertisers spent $3.8 billion on advertising through October, 5% less than last year.
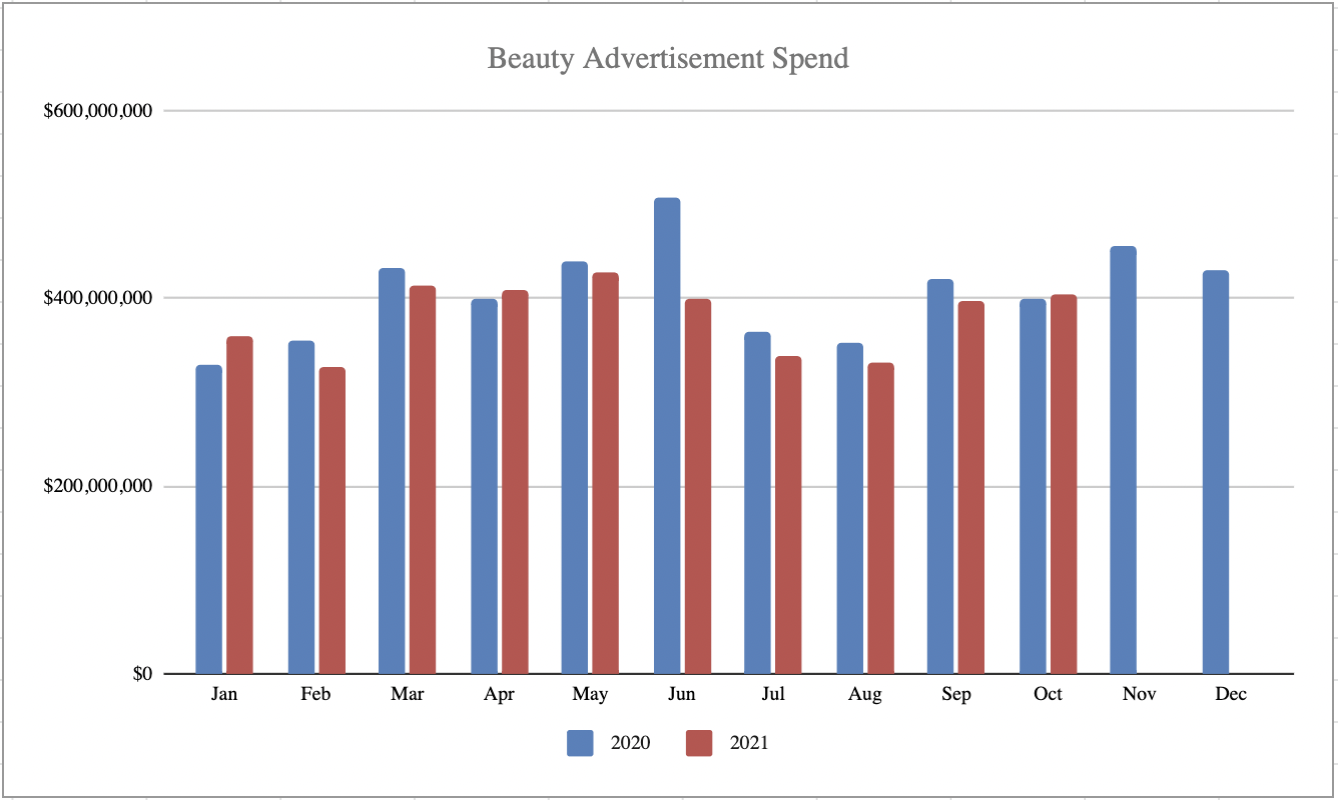
The majority of the spending went to TV, in which advertisers spent $1.8 billion, down 20% from last year.
The next top format was digital, in which they spent $1.2 billion. Digital experienced the largest growth, increasing by 92% year-over-year.
Print fell 24%. Advertisers spent $846.1 million in the format through October.
Number of Advertisers
9.9 thousand advertisers spent $3.8 billion in 2021 compared to 7.7 thousand advertisers spending $4 billion in 2020.
Advertiser Retention
In the overall category, travel advertisers had a 51% retention rate between 2020 and 2021 (January – October).
5 Top Advertisers – Which Advertisers Spent the Most in 2021?
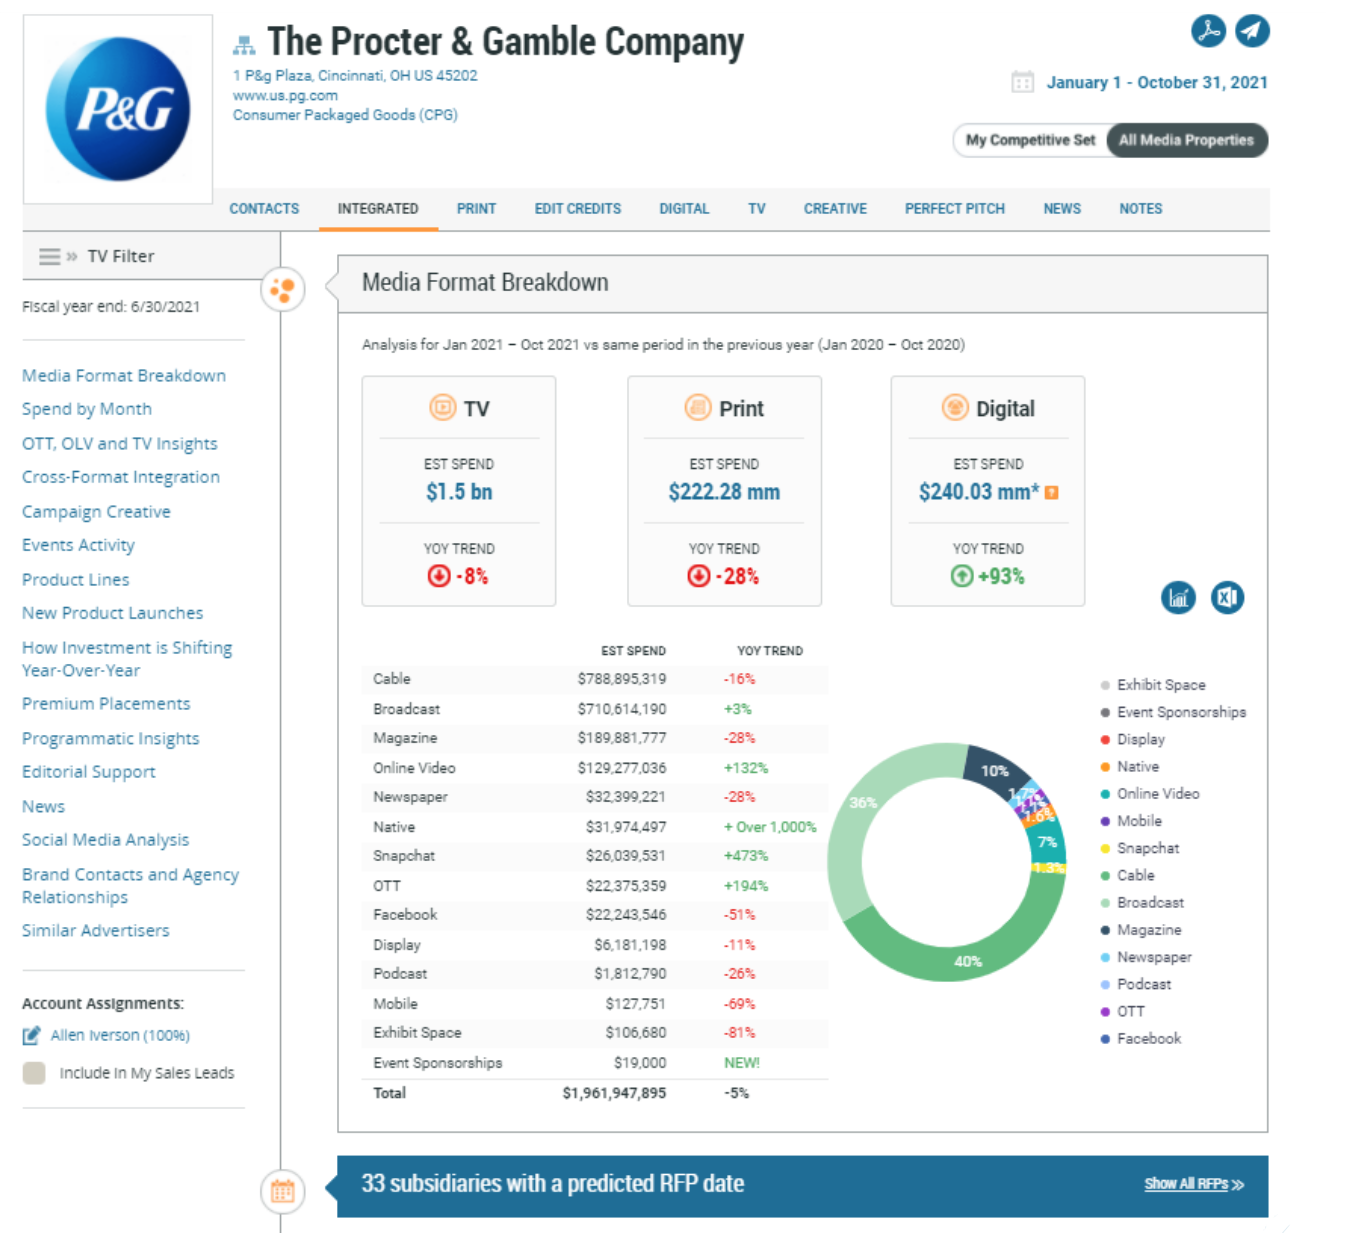
1. The Procter & Gamble Company
The Procter & Gamble Company is a top spender in the beauty category, with over $1.9 billion going towards promoting their products.
While their ad spend is down 5%, their digital spending is up 93% year-over-year. Spending on online video has increased by 132%, native advertising has increased by over 1000%, spending on Snapchat ads has increased by 473%, and OTT ad spend has increased by 194%.
Below is a breakdown of The Procter & Gamble Company’s ad spend thus far in 2021. We predict they will likely have 33 upcoming RFPs issued. MediaRadar can help you connect with 194 key contacts at The Procter & Gamble Company.
2. Unilever PLC
Unilever PLC is also a big advertiser in the beauty market, with 71% of their budget going to promoting their consumer packaged goods. Since last year, their ad spending increased by 16%.
Digital spending has increased 201% year-over-year. Online video spending increased by 174%. Unilever’s spending on native advertising went up by over 1000%. Facebook, OTT, and Display ads all increased by over 100%.
Below is a breakdown of Unilever PLC’s ad spend thus far in 2021. We predict they will likely have 27 upcoming RFPs issued. MediaRadar can help you connect with 173 key contacts at Unilever PLC.

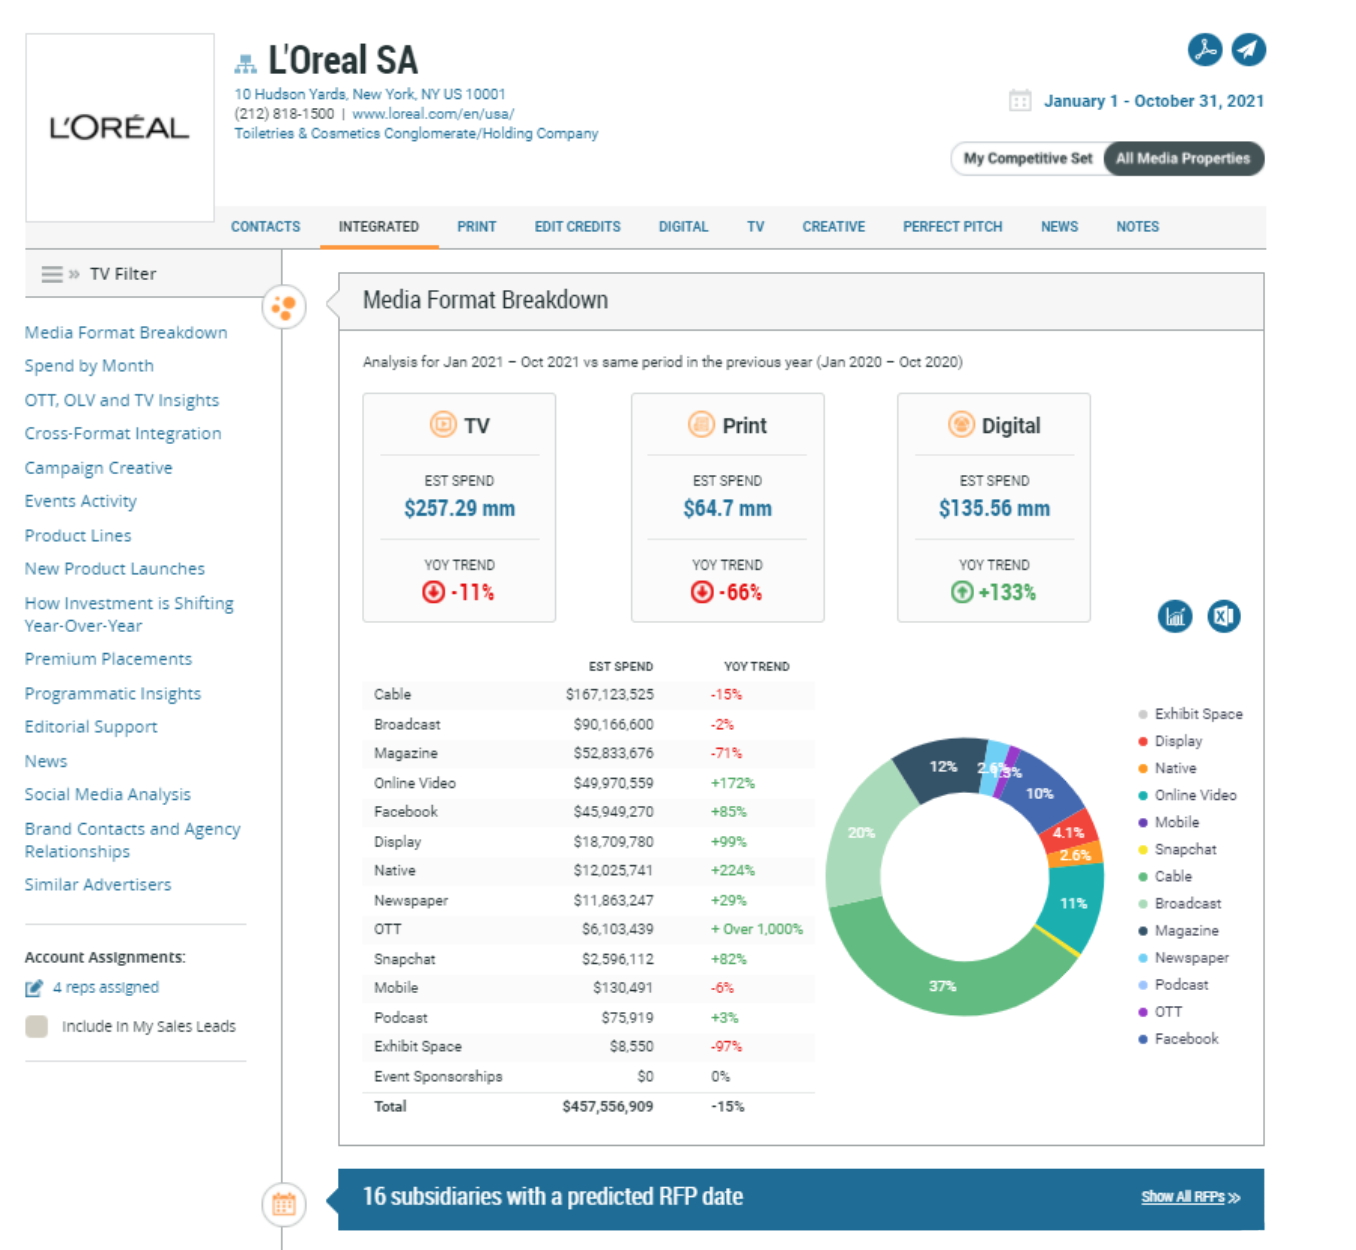
3. L’Oreal SA
L’Oreal SA is a top advertiser in the beauty market, with 97% of their overall budget on ads promoting their beauty products. Their ad spend is down 15% since last year, but their investment in digital advertising has gone up 133% year-over-year.
While TV and Print advertisements are down, online video, social media, display, native, and OTT advertisements all saw increases in investments.
Below is a breakdown of L’Oreal SA’s ad spend thus far in 2021. We predict they will likely have 16 upcoming RFPs issued. MediaRadar can help you connect with 100 key contacts at L’Oreal SA.
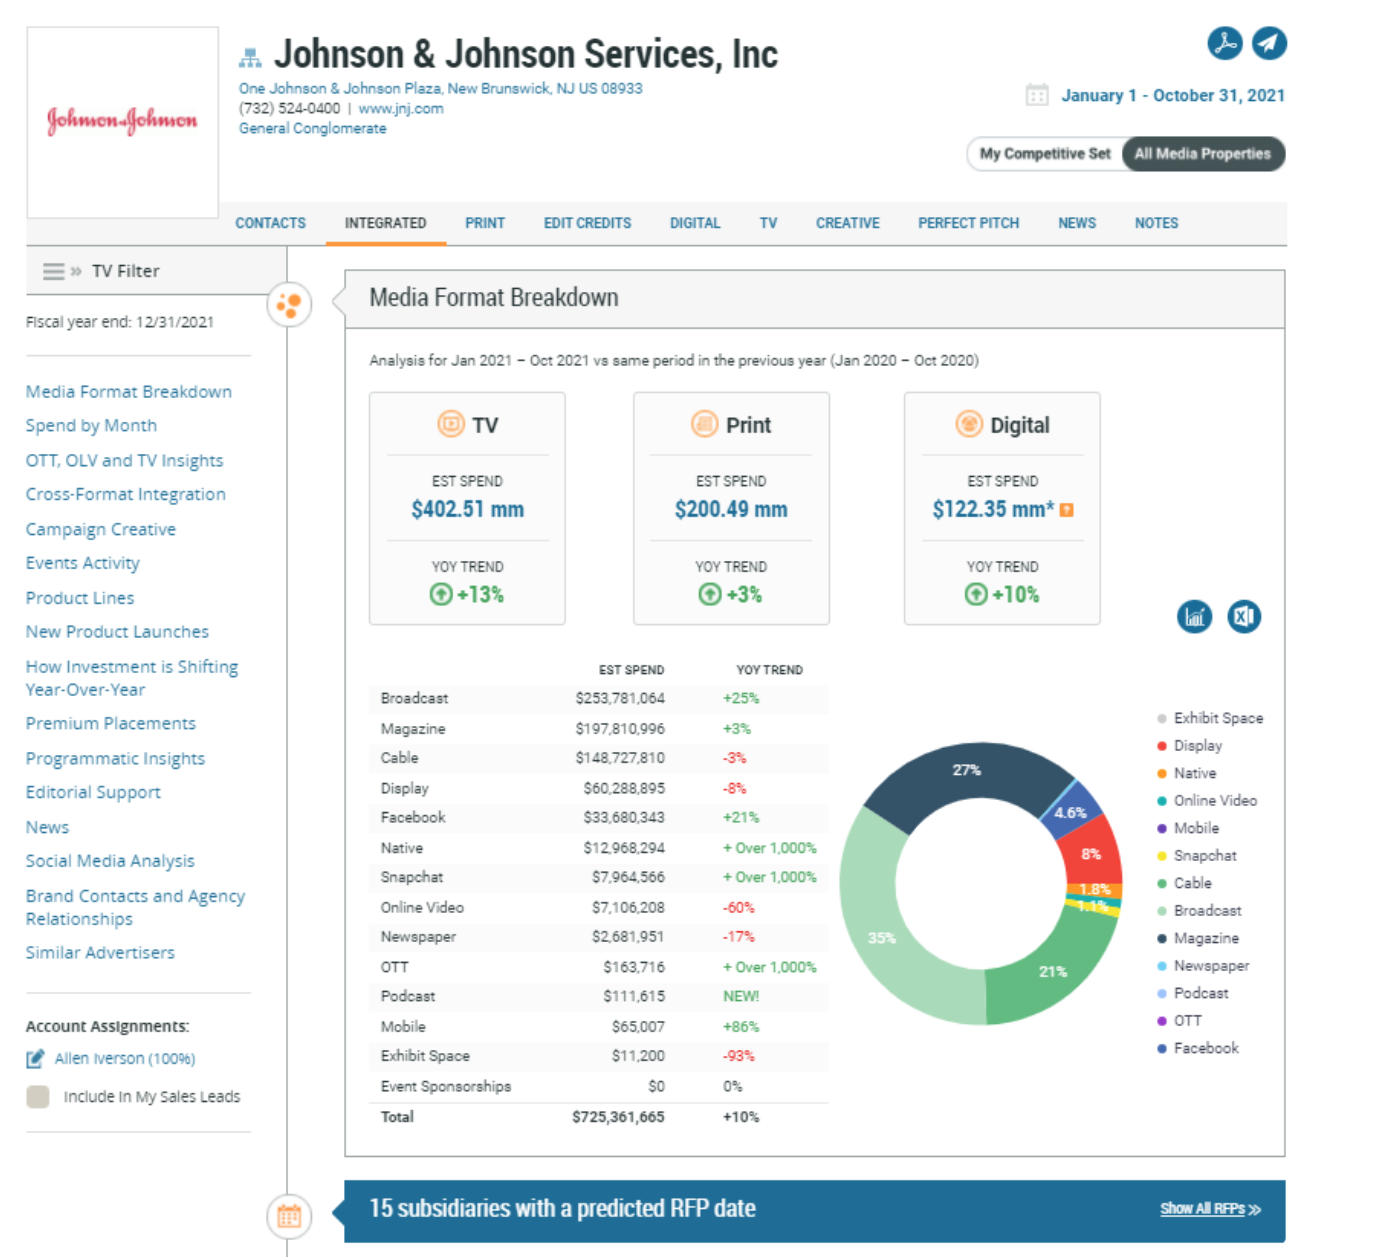
4. Johnson & Johnson Services, Inc.
Johnson & Johnson Services, Inc. is also a top advertiser in the beauty industry, with 40% of their budget spent promoting their beauty products. Their advertising spend has increased by 10% since last year.
Digital advertising saw a large increase in investments. Native, Snapchat, and OTT ads all saw increases of over 1000% year-over-year.
Below is a breakdown of Johnson & Johnson Services, Inc’s ad spend thus far in 2021. We predict they will likely have 15 upcoming RFPs issued. MediaRadar can help you connect with 102 key contacts at Johnson & Johnson Services, Inc.
5. GlaxoSmithKline, Plc
GlaxoSmithKline, Plc. is another top advertiser in this category, dedicating 15% of their overall budget to ads promoting their pharmaceutical products.
GlaxoSmithKline’s ad spend is down 7% in comparison to last year, with their investment in digital up 6% year-over-year.
Nearly $45mm goes to digital advertising, primarily Facebook and Online Video advertisements.
They have made significant investments in Facebook, increasing their advertisements by 114%. They also increased spending in OTT which is 234% up and Native advertising, which is up over 558%.
Over $508 million is used for TV advertisements, with over $270 million spent on cable and $237 million allocated for broadcast ads. $56 million is going toward print advertisements, $50 million of which were allocated for magazine ads.
Below is a breakdown of GlaxoSmithKline, Plc ad spend thus far in 2021. We predict they will likely have 16 upcoming RFPs issued. MediaRadar can help you connect with 98 key contacts at GlaxoSmithKline, Plc.

For more updates like this, stay tuned. Subscribe to our blog for more updates on coronavirus and its mark on the economy.