As we approach the end of the year, we’ll be covering trends from 22 key markets. We’ll recap what each industry has experienced over the past year and what to watch for in 2022. Learn who are the top advertisers from each category and how they spend across formats.
The U.S. is one out of only two countries in the world that allows pharmaceutical companies to advertise prescription drugs directly to consumers, according to NPR.
Though there are valid concerns about advertising prescription drugs, advertising has the power to improve public health.
“Consistent with our first research, when people see an ad that’s relevant to their condition, they will go online and do more research about the drug,” said Marcella Milliet Sciorra, DeepIntent’s senior VP of marketing. With the right content, people can “have better educated discussions with their doctor.”
Pharmaceutical advertising can motivate people to research helpful drugs and adhere to their prescriptions. And pharma companies are more than willing to spend big money to promote their products.

MediaRadar Insights
Overall Spending and Breakdown Across Formats
Pharmaceutical company marketing budgets are ever-expanding. In 2021, spending was up 11% from the year prior (through October.)
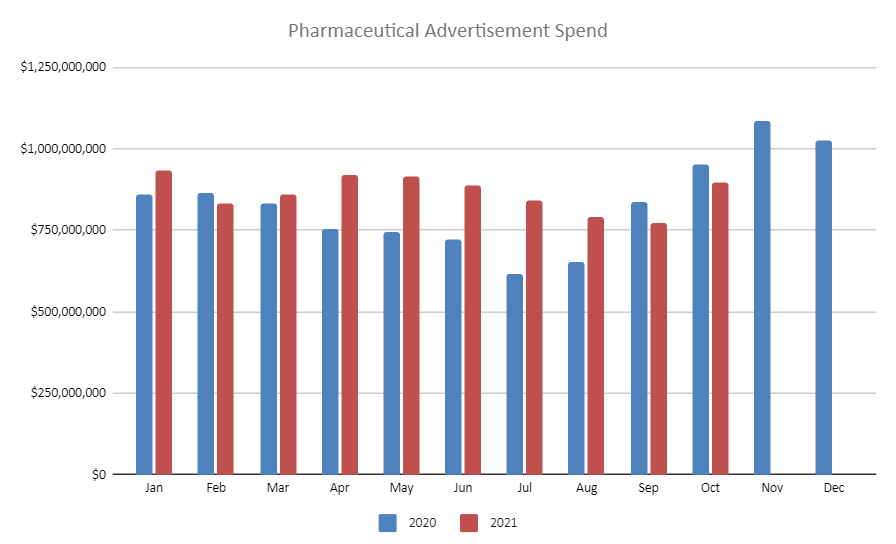
TV makes up the lion’s share of spending. Pharma advertisers spent $5.8 billion on TV placements, a 7% increase year-over-year.
Unsurprisingly, digital saw the biggest boost in spending this year. Digital advertising from pharma companies increased 60%, reaching up to $1.5 billion.
Print was down 10%, but was still a sizable $1.3 billion.
Number of Advertisers
11.2 thousand advertisers spent $8.7 billion in 2021 compared to 10.2 thousand advertisers spending $7.8 billion in 2020.
Advertiser Retention
Pharmaceutical advertisers had a 57% retention rate between 2020 and 2021 (January – October).
5 Top Advertisers – Which Advertisers Spent the Most in 2021?
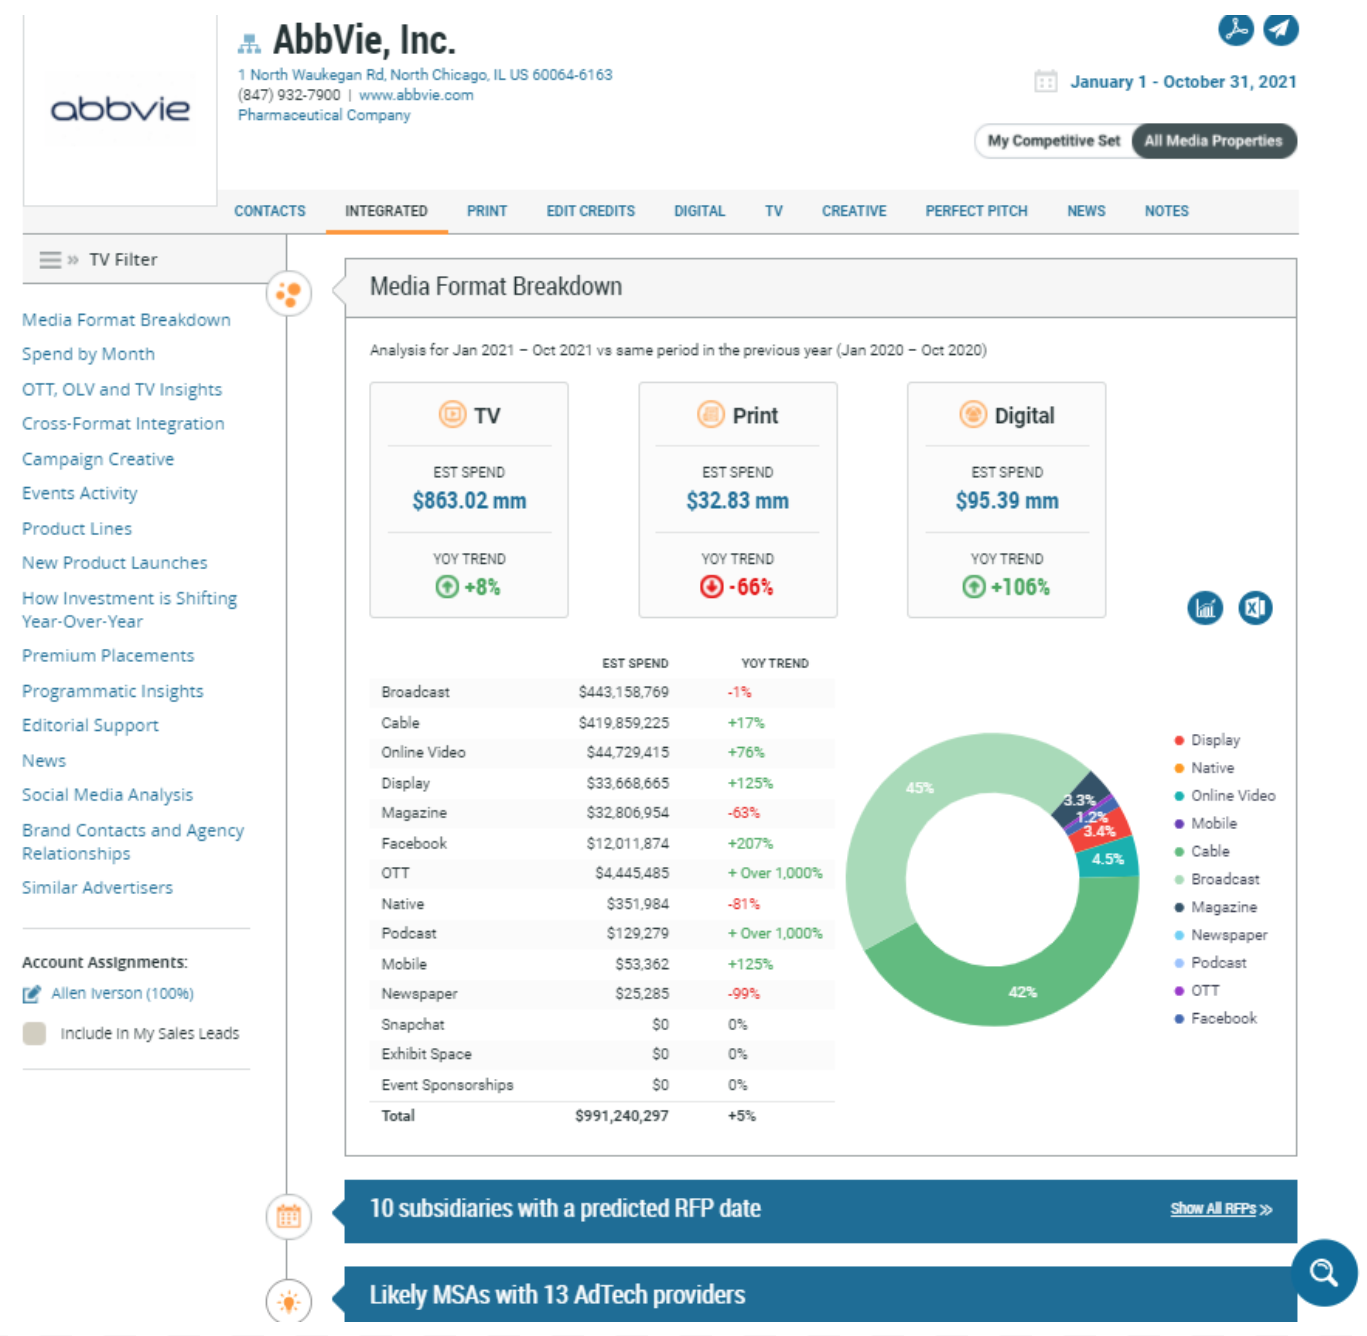
1. AbbVie, Inc.
AbbVie, Inc. is the top advertiser in this category, dedicating 100% of their overall budget to ads promoting their pharmaceutical products.
AbbVie’s ad spend is up 5% in comparison to last year, with their investment in digital up over 106% YOY. They have made significant investments in OTT and Podcast ads. Spending has been up over 1000% in both categories.
Over $863 million is being allocated to TV advertisements, with $443 million going towards broadcast ads and $419 million toward cable ads.
AbbVie spent $33 million on print advertising, with the majority on magazine advertisements.
$95 million was spent on digital advertising, $44 million of which was allocated to online video ads.
Below is a breakdown of AbbVie, Inc. ad spend thus far in 2021. We predict they will likely have 10 upcoming RFPs issued. MediaRadar can help you connect with 38 key contacts at AbbVie, Inc.
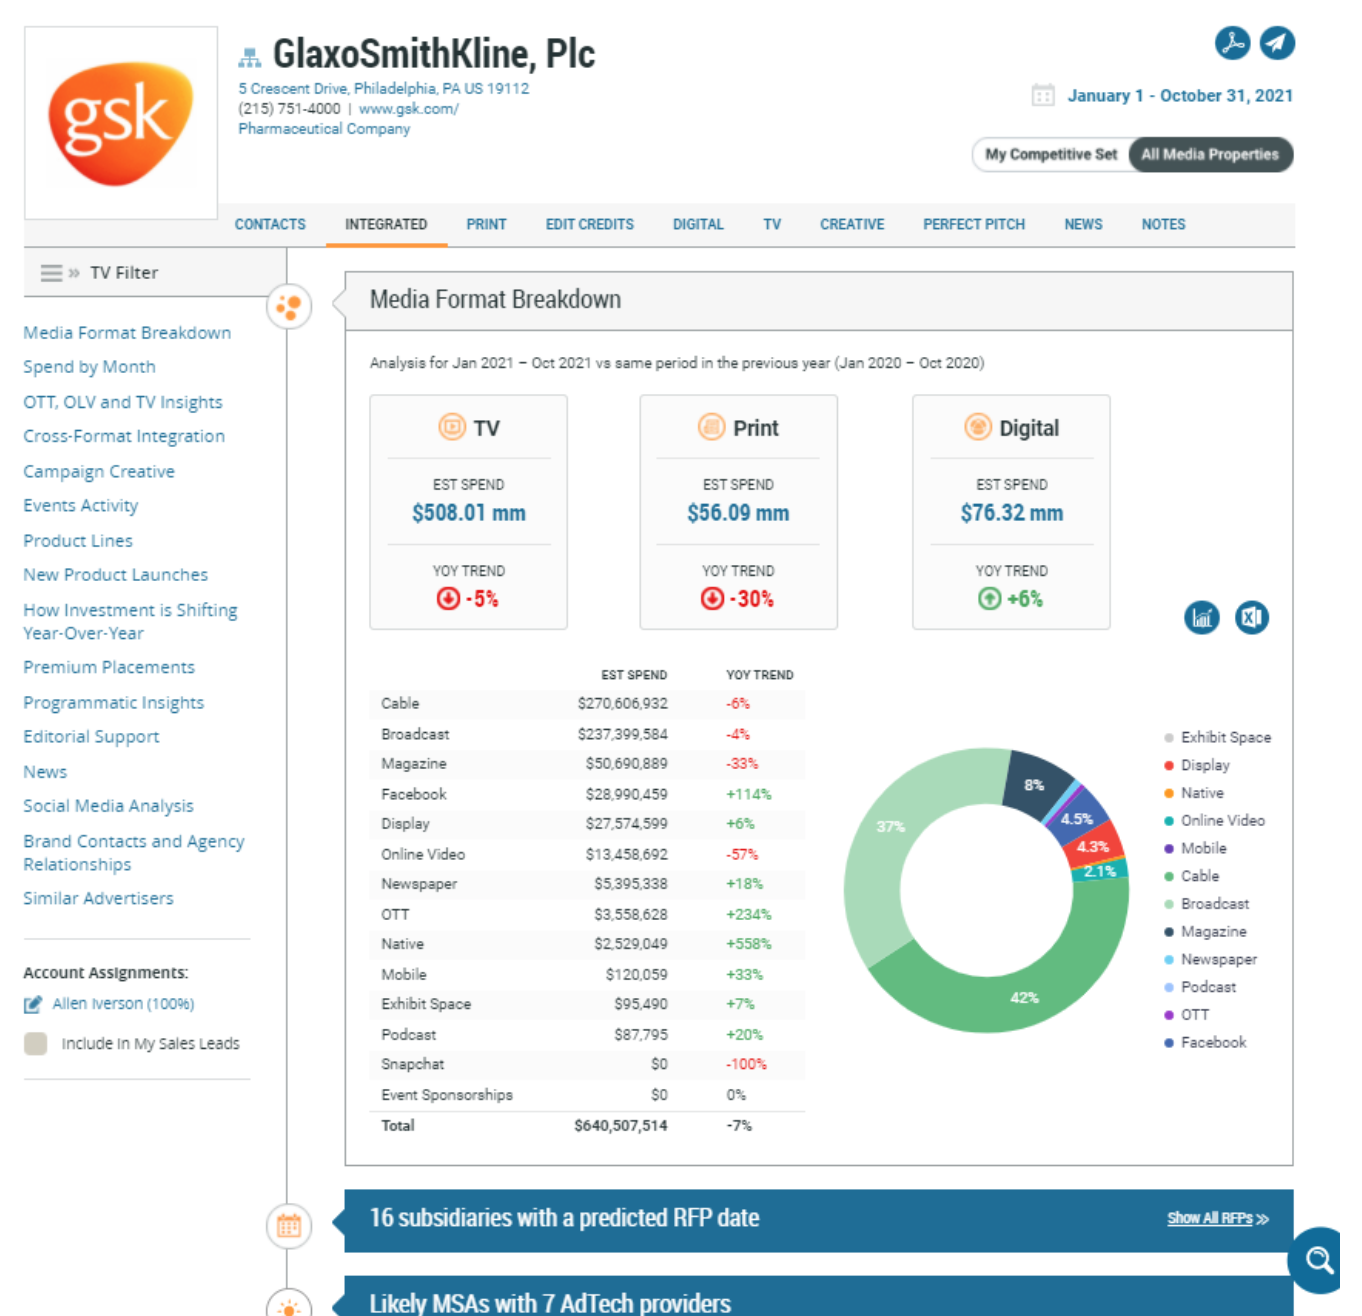
2. GlaxoSmithKline, Plc
GlaxoSmithKline, Plc. is another top advertiser in this category, dedicating 85% of their overall budget to ads promoting their pharmaceutical products.
GlaxoSmithKline’s ad spend is down 7% in comparison to last year, with their investment in digital up 6% year-over-year. They have made significant investments in Facebook, increasing their advertisements by 114%. They also increased spending in OTT which is 234% up and Native advertising, which up over 558%.
Over $508 million is used for TV advertisements, with over $270 million spent on cable and $237 million allocated for broadcast ads. $56 million went toward print advertisements, in which $50 million was allocated for magazine ads.
More than $76 million went to digital advertising, primarily Facebook and Online Video advertisements.
Below is a breakdown of GlaxoSmithKline, Plc ad spend thus far in 2021. We predict they will likely have 16 upcoming RFPs issued. MediaRadar can help you connect with 98 key contacts at GlaxoSmithKline, Plc.
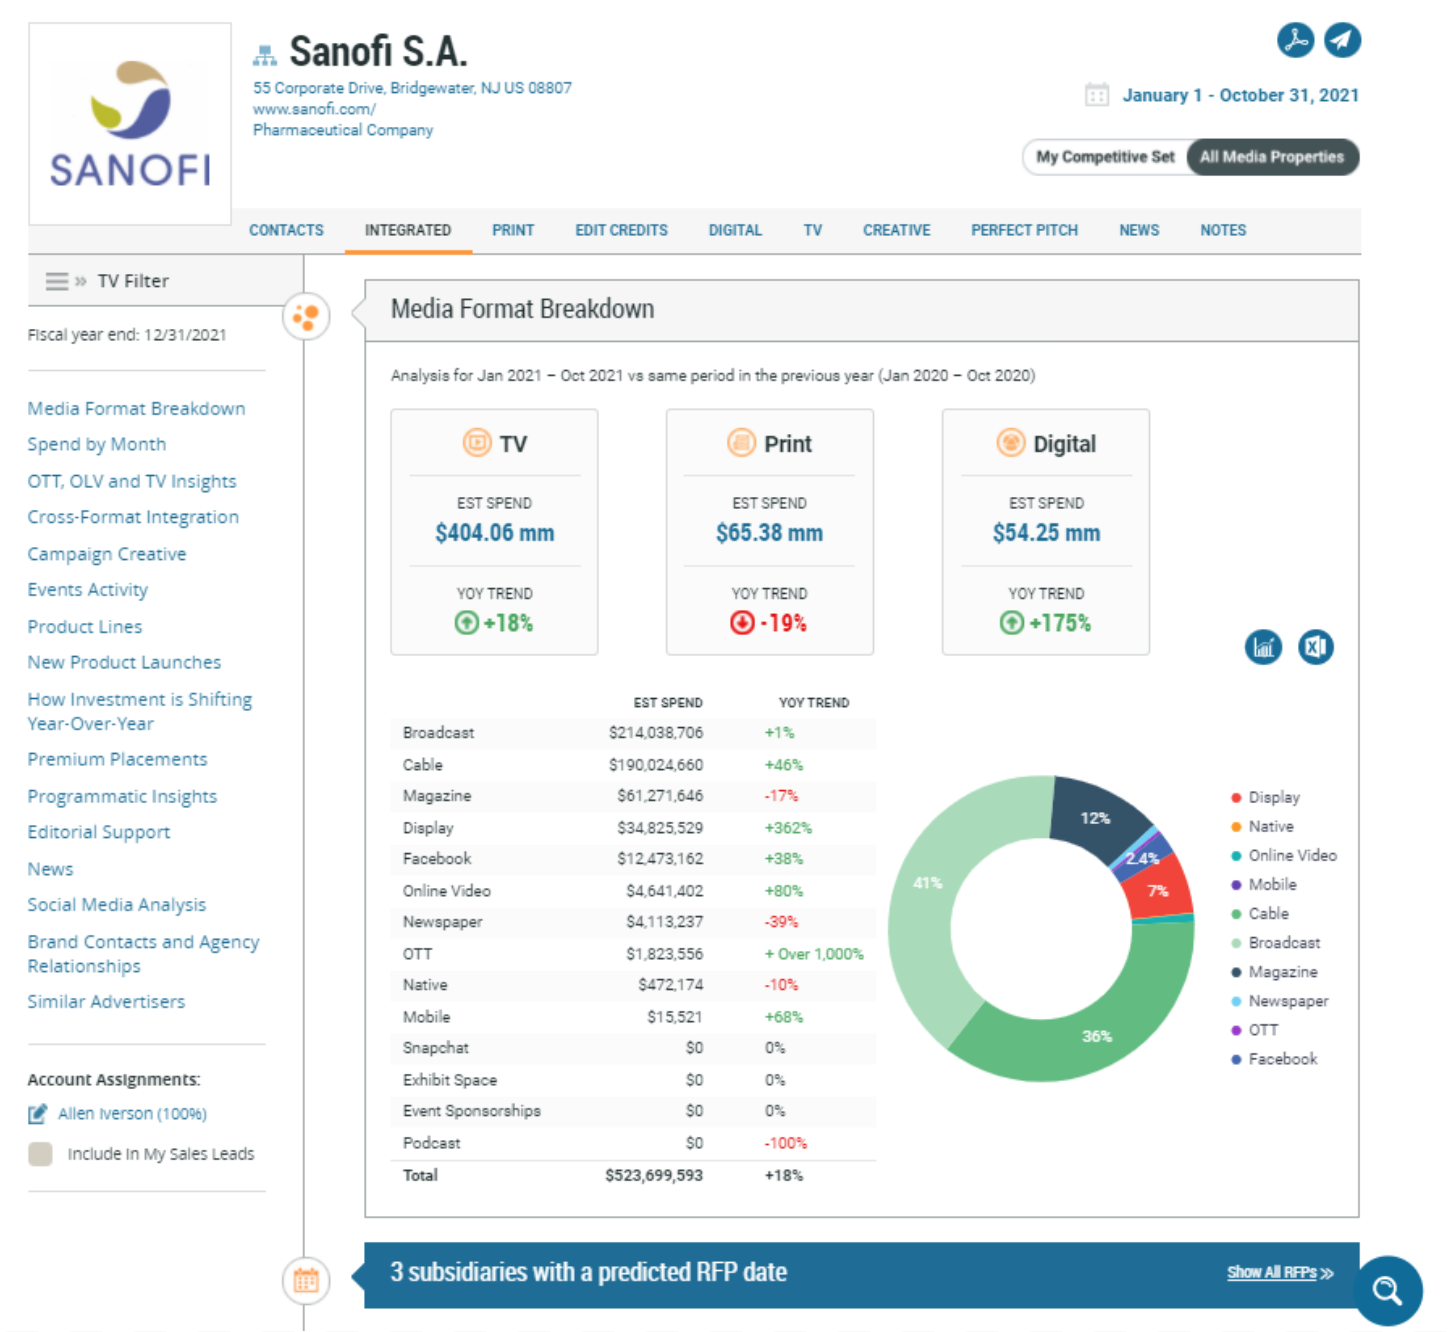
3. Sanofi S.A.
Sanofi S.A. is also a top advertiser in this category, dedicating 95% of their overall budget to ads promoting their pharmaceutical products.
Sanofi’s ad spend is up 18% in comparison to last year with their investment in digital up 175% year-over-year. They have made significant investments in OTT advertising, increasing spending by over 1000% since last year.
They also increased spending in Display by 362%
Over $404 million was allocated to TV advertisements, with $214 million going to Broadcast advertisements and $190mm going to Cable advertisements.
Over $65 million went toward print, with over $61 million allocated to magazine ads and just over $4 million in newspaper ads.
Over $54 million went to digital advertising, primarily in Facebook and Online video advertisements.
Below is a breakdown of Sanofi S.A.’s spend thus far in 2021. We predict they will likely have 3upcoming RFPs issued. MediaRadar can help you connect with 28 key contacts at Sanofi S.A.
4. Eli Lilly and Company
Eli Lilly and Company is another top advertiser in this category, dedicating 100% of their overall budget to ads promoting their pharmaceutical products.
Eli Lilly and Company’s ad spend is up 40% in comparison to last year.
This year, Eli Lilly and Co spent over $353 million on TV advertisements, with $273mm going to Broadcast ads and $80mm going to Cable ads.
$64mm was spent on digital advertising, primarily in Facebook, Online video, and OTT ads.
with their investment in digital advertising up 53% YOY. They have made significant investments in OTT and Native advertising, both of which saw increased spending by over 1000% since last year. Eli Lilly and Co also began advertising with Snapchat this year.
Below is a breakdown of Eli Lilly and Company’s spend thus far in 2021. We predict they will likely have 4 upcoming RFPs issued. MediaRadar can help you connect with 38 key contacts at Eli Lilly and Company.

5. Novartis AG
Novartis AG is also a top advertiser in this category, dedicating 100% of their overall budget to ads promoting their pharmaceutical products.
Novartis’ ad spend is up 33% in comparison to last year.
Digital advertisements up 112% year-over-year, reaching up to $110 million. They have made significant investments in OTT advertising, which saw spending increase by over 1000% since last year.
This year, Novartis spent over $250 million on TV advertisements, with over $135 million going to Cable ads and $114 million going to Broadcast ads.
Below is a breakdown of Novartis’ spend thus far in 2021. We predict they will likely have 4 upcoming RFPs issued. MediaRadar can help you connect with 46 key contacts at Novartis AG.

For more updates like this, stay tuned. Subscribe to our blog for more updates on coronavirus and its mark on the economy.