The pandemic has impacted the entire nation, but its influence greatly varies across state lines.
Those living in California had a different experience than those living in Texas. And those living in New York had a different experience than those in Florida.
Much of this has to do with public policy. Restrictions varied greatly among locations, leading to differences in regional ad sales.
Due to the variations, we analyzed pandemic regional trends from four states—California, Texas, Florida, and New York—to help you with your regional sales strategies.
We encourage you to subscribe to our blog for the latest data surrounding the advertising industry. We will provide daily updates as COVID-19 continues to make its mark on the US economy.

Regional Advertising Trends
Overall our data shows that states with stricter policies, like California and New York, were more impacted by the loss of ad buying.
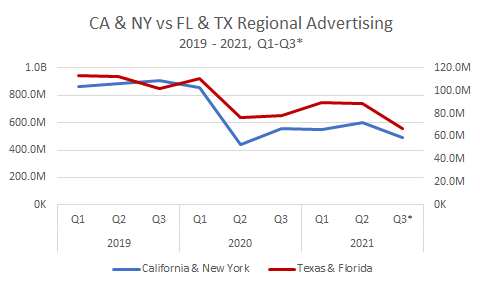
The large dip in Q2 2020 was felt across all regions and primarily in print publications. Ad spend in California and New York fell 49%. In Texas and Florida, it fell 31%. Overall, $450 million of ad spending was lost from Q1 2020 to Q2 2020.
Spend has not yet fully recovered to pre-pandemic levels, but there are key differences among categories.
Real Estate
Realtor advertising in CA and NY recovered immediately from the 39% drop between Q1 and Q2 2020. Advertising spend in Q3 2020 reached its high in CA and NY when people were looking to move out of large cities.
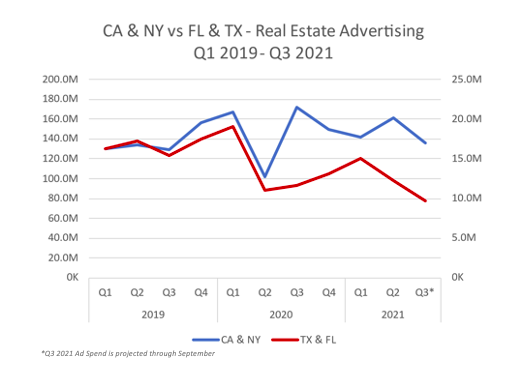
TX and FL dropped slightly more (42%) from Q1 – Q2 2020 and their recovery has been more gradual. It took three quarters to increase 28%. This is likely due to a case where demand outweighed supply. In July, Texas major metro areas reported less than a two-month supply of houses for sale.
Energy
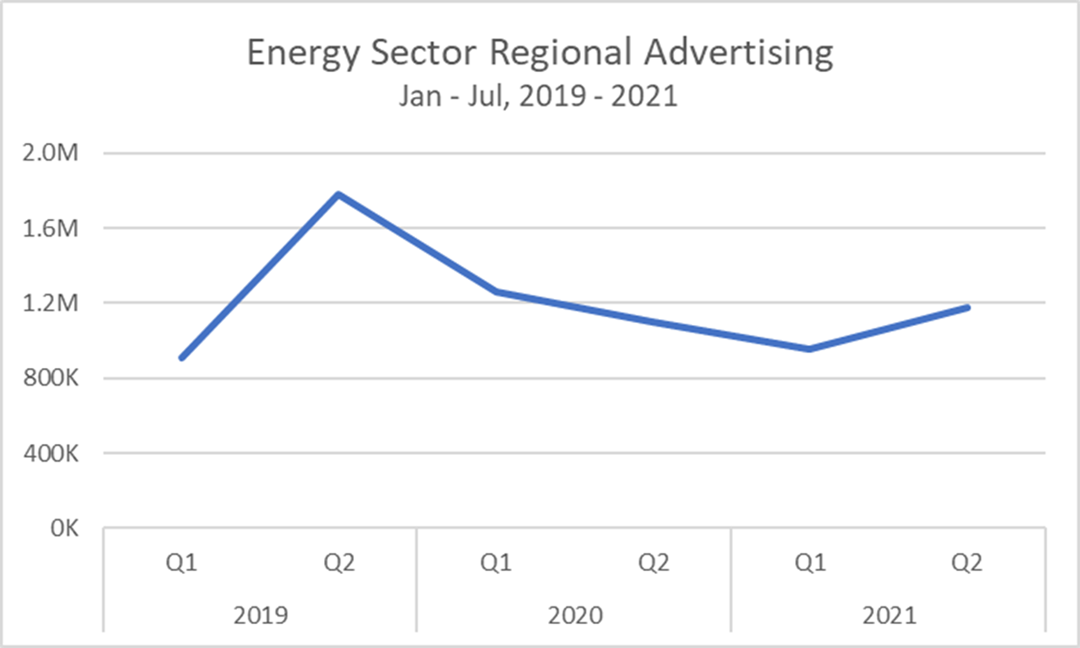
Overall, local Energy advertising remains dim compared to 2019.
Advertiser spend peaked in 2019 at $1.8 million. It has since fallen 52%.
Year-over-year, the category is down 10% (January – June, 2021 vs 2021). Nationally, the category is flat year-over-year.
More recently, spending has been improving. It saw a 23% improvement over Q1 in 2021. On a national level, energy advertising between Q1 and Q2 2021 rose 102%.
It’s worth noting that ad spending is driven by renewable energy, which currently makes up 66% of the total category’s spend.
Restaurants and Bars
Texas and Florida were among the first states to lift in-person restrictions, which we see in the immediate return of spending (in Q2 2021). Spending in Texas and Florida grew 25% between Q1 and Q2 of 2021, and has almost recovered to pre-pandemic levels of Q2 2020 (-.1%).
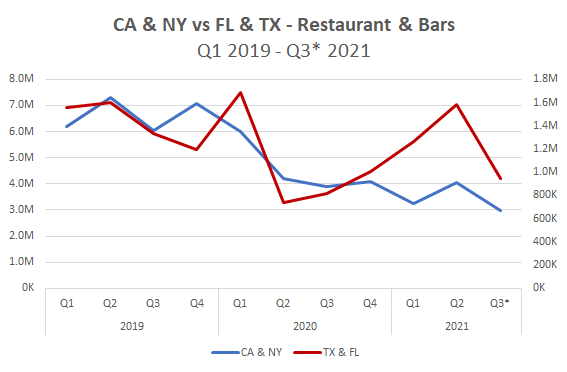
However, we see a strong drop in the Q3 projected numbers. This is likely a result of the Delta variant resurgence. 60% of Americans have changed their restaurant habits due to the rise of the variant, impacting the industry at large.
Despite reopening, NY and CA are still down almost 50% from pre-pandemic levels.
With the Delta variant causing outbreaks again, the economy is experiencing a slowdown. However, economists predict that it will accelerate once again. Because we don’t know when this will be exactly, we’ll keep updating you with the most recent data to help inform your sales strategy.
For more updates like this, stay tuned. Subscribe to our blog for more updates on coronavirus and its mark on the economy.