When Jawed Karim, the co-founder of YouTube, posted the now-infamous video of himself at the zoo in front of two adorable elephants, there’s no way he could’ve predicted the meteoric rise of his creation.
If you would’ve asked him in 2005 how many monthly active users YouTube would have in 2022, there’s no way he would’ve said more than two billion.
If you questioned him about the amount of video people would upload to YouTube, 500 hours a minute probably wouldn’t have been on the tip of his tongue.
If you’d asked him about his expectation about ad revenue, he’d likely say that he didn’t have plans to run ads on YouTube. He certainly wouldn’t have said that it’d yield $209.49 billion in 2021—$115 billion more than another media goliath, Meta (formerly Facebook).
YouTube’s climb has been nothing short of historical and something we may never see another company duplicate, which is why we’re always so excited to look at our data to see how brands are investing in YouTube advertising.
Our new trend report, In a League of its Own: YouTube Advertising Sales, looks at overall spending, which industries are spending the most, which ad formats rule and more.

Not a surprise: YouTube ad spending increased
You’ll be sorely mistaken if you’re reading this assuming that the pandemic put a ding in YouTube’s armor.
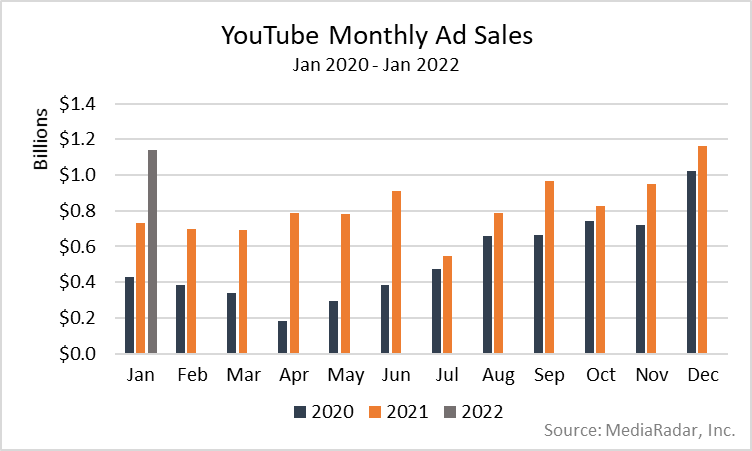
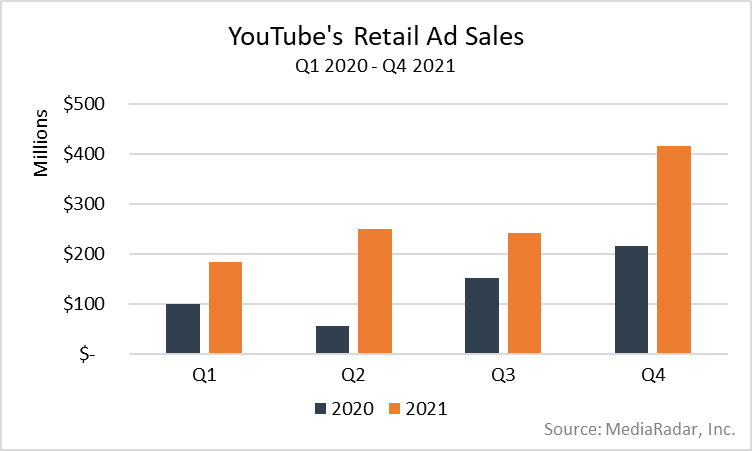
While traditional brand marketing declined on YouTube briefly during the pandemic, overall ad sales grew by 56% year-over-year (YoY), thanks to a healthy Q2 and busy holiday season that saw advertisers spending 18% more than they did during the same quarter in 2020.
Its record-breaking ad sales don’t seem to be enough for the company. YouTube’s expected to be present during this year’s TV upfronts, signaling that it’s intensifying its hunt to lure more dollars away from linear TV advertisers—a move that no doubt has other media players, including ViacomCBS, NBC Universal (NBCU) and Fox paying attention.
If it ain’t broke, don’t fix it
If you looked over this data without knowledge of the past couple of years and the state of digital advertising, you might think 2021 was a year like any other.
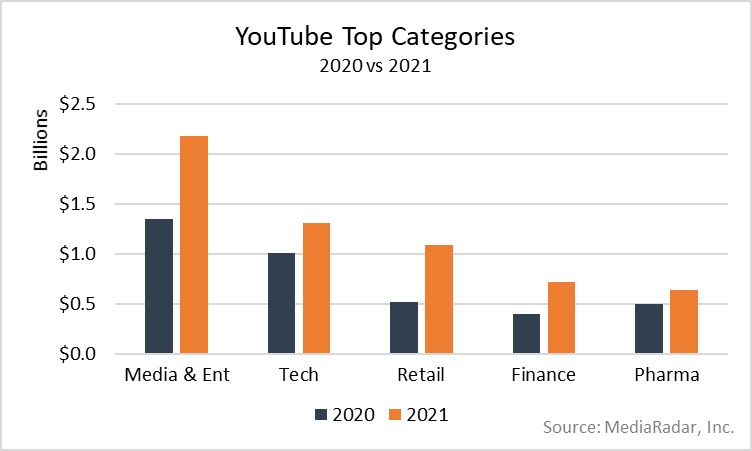
After all, the same industries that poured their ad dollars into YouTube in the past were back spending more than ever.
Last year, advertisers from the Media & Entertainment, Tech, Retail, Finance and Pharma industries bought the most YouTube ads, accounting for 60% of all buys.
A level deeper, the data reveals two relatively unexpected stories, both of which revolve around the spending habits of Media & Entertainment and Retail advertisers.
Hint: The storylines probably aren’t what you expect.
The first one centers around the fact that Media & Entertainment advertisers only increased their spending by 5% YoY in Q3 and Q4, which is surprising considering the historical shopping surge during this time of year.
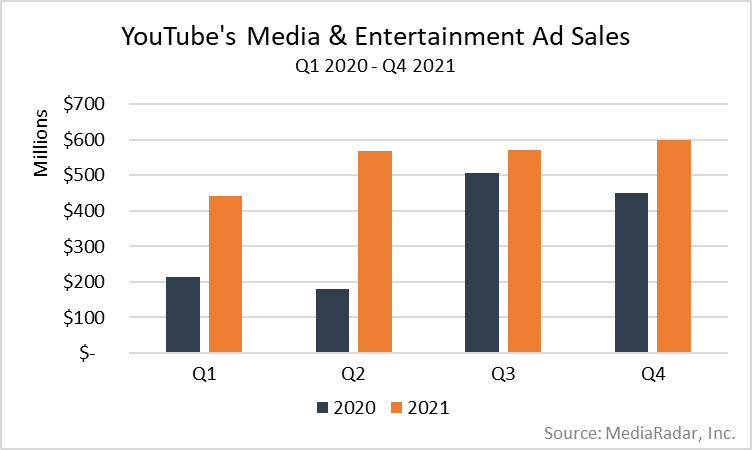
The second storyline focuses on a substantial increase from Retail advertisers, a surprising development considering the reserved spending habits of millions of people during the pandemic.
Some things never change
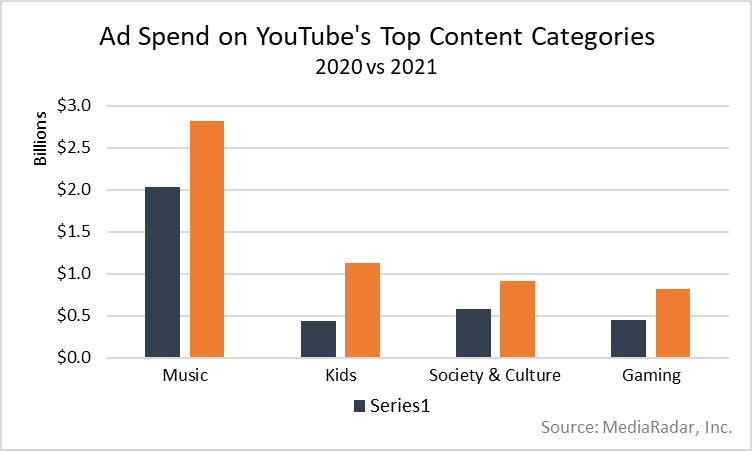
Like 2020, advertisers spent the most to get their ads to play with a few core content categories: Music, Kids, Society & Culture, and Gaming. (In 2021, the programming categories’ weight of total ad buys remained relatively flat, increasing by only 1% YoY.)
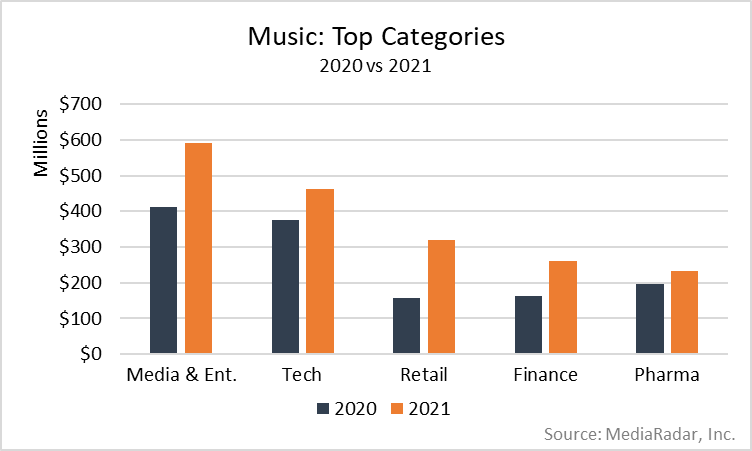
Music once again got the most attention, with 13 thousand companies promoting nearly 23 thousand brands.
Of these companies, Retailers increased their buys the most, spending 102% more than last year—YouTube can thank Amazon and Walmart for a big part of that, with the former spending 46% more than 2020 and the latter increasing buys by almost 16x to promote Walmart+ and Indian e-commerce company Flipkart (Walmart owns a controlling stake).
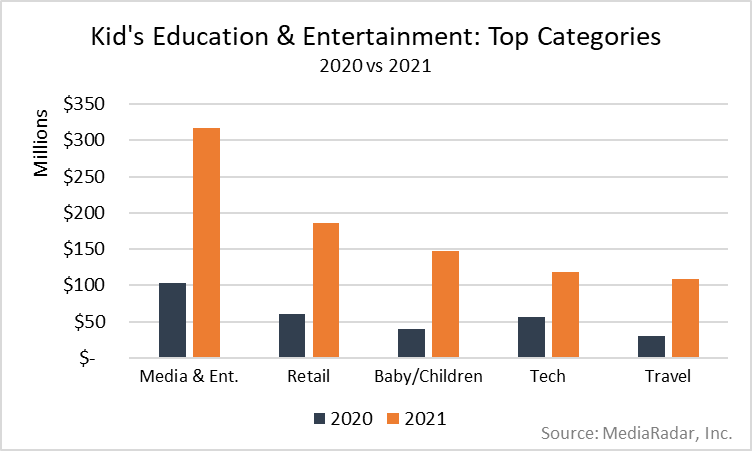
Arguably the most significant difference between this year and last was the willingness of brands to run ads on channels related to Kids content.
In 2021, spending on this content category increased by almost 160% as toy companies, like Zulu, and travel brands, like Walt Disney World, significantly increased their spending.
While the increase may surprise some, it was inevitable following YouTube’s implementation of a system that allowed channel owners to identify child-directed contact to maintain compliance with Children’s Online Privacy Protection Rule (COPPA)—something it had to do as part of
its settlement for alleged violations of children’s privacy laws.
Spending on content categories related to Society & Culture and Gaming increased in 2021 as well.
YouTube Advertising: Resilient Like No Other
During a period in history that saw so many companies experience tremendous financial losses, YouTube thrived.
Are we surprised? No.
Still, YouTube’s continued climb in the face of so much challenge has been remarkable and adds yet another feather in its cap as the uncontested leader of digital advertising.
Read our full trend report that dives deeper into YouTube advertising trends.