Facebook made impressive earnings last quarter—up significantly from the same period last year.
Our data suggests that Facebook has stayed true to form: most of their revenue comes from the cumulation of thousands of small, niche advertisers (with a handful of big brands thrown in.)
And now that the economy is recovering, there has been a massive influx of advertisers. We saw an 87% jump in the number of advertisers in Q2 compared to last year.
Who are these advertisers and have the top spenders shifted?
We encourage you to subscribe to our blog for the latest data surrounding the advertising industry. We will provide daily updates as COVID-19 continues to make its mark on the US economy.

Facebook’s growth is on fire
Facebook has been exceeding expectations lately—and recently became the fifth U.S. company to hit a $1 trillion market cap.
On a Q2 earnings call last week, Facebook reported $29.1 billion in revenue, which was up 55.6% year-over-year. Facebook hasn’t seen this quick of growth since 2016. The company attributed the significant growth to increased ad prices (a 47% average price increase per ad) and the continued demand for digital transformation among small businesses.
According to Mark Zuckerberg on the earnings call, more than 3.5 billion people actively use one or more of Facebook’s services.
At that scale, it’s no wonder people assume that Facebook is a monopoly. But a judge dismissed an FTC complaint about the outsized nature of the company in June. With that ruling, Facebook didn’t face any immediate breaking up of the company.
But it does recognize that regulatory and industry headwinds are still on the way.
Antitrust bills are making their way through House and Senate committees. And with the Apple iOS 14.5 update that took place, only 4% of American users opt-in to tracking.
Though Facebook surpassed analyst expectations, they’ve warned investors that the fast growth won’t last forever. But for now, advertisers are still flocking to the platform.
MediaRadar Insights
With this earnings update, we were curious to see how spending on Facebook has shifted across categories since last year.
Overall, in Q2 2021, 37.3 thousand advertisers spent $5.5 billion specifically on Facebook (not including its other services). This is up 52% in spend from Q2 2020 where 20 thousand advertisers spent $3.63 billion.
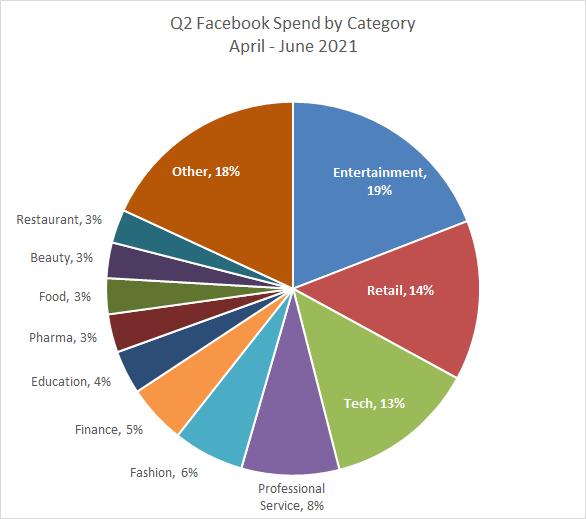
Facebook brings in most revenue from small advertisers, but last year tech was a big spending category as it largely benefited from the pandemic. Between 2020 and 2021, the biggest shift in spending has happened between ‘Tech’ and ‘Other.’
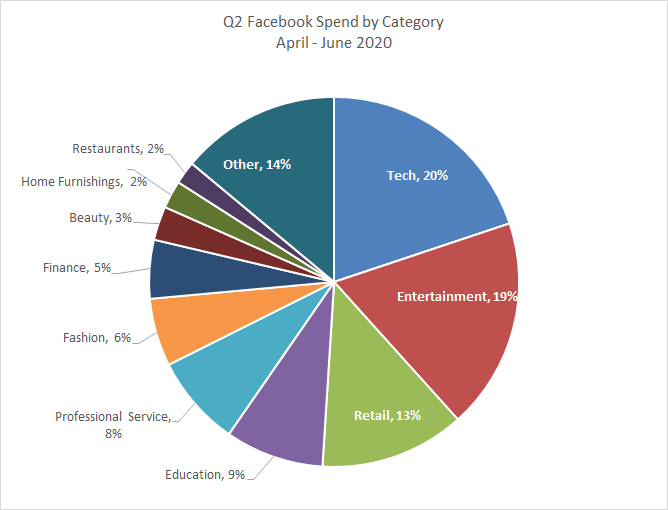
Tech dropped its spending by 7% and the ‘Other’ category (which is made up of highly niche and local businesses) increased by 4%.
The remaining categories roughly stayed the same.
“Our strongest verticals are those that have performed well through the — throughout the pandemic, including e-commerce, retail, and CPG. And we’re also seeing continued recovery in others like travel that were hit hard by COVID,” said Chief Operating Officer, Sheryl Sandberg on the earnings call.
She pointed to a success story of a small business in New York City—The Pizza Cupcake. During the pandemic, the company (that used to operate at popup shops) was forced to become an eCommerce food service.
With Facebook’s different solutions for small businesses, the company was able to expand not just in the New York area, but across 28 states.
The total ad spend from these smaller ‘Other’ brands totaled $485mm in Q2 2020, and increased to $997mm in 2021.
Facebook’s different solutions that make digital transformation possible for small, family-run businesses are what make it unique as an ad tech solution. But that being said, that doesn’t mean national brands don’t use the service.
In Q2 2021, the top five advertisers were:
- HBO Max
- Capital One Shopping
- Disney+
- Walmart
- The Home Depot
Their spend totals $192 million, which is only 3% of all spend. This suggests that like previous quarters, Facebook revenue is primarily made up of smaller campaigns targeting specific audiences.
Curious how the top spenders have changed from last year?
In Q2 2020, the top five spending brands were:
- Capital One Shopping
- Wix
- Biden for President
- AT&T
- Progressive.
The only top spender that remained consistent was Capital One Shopping, indicating another advantage of Facebook advertising: its flexibility.
Advertising spending on Facebook can change depending on which brand’s are benefiting from the pandemic at the current moment, and which ones are still struggling. As the pandemic changes form, we’ll keep you updated on our most recent data.
For more updates like this, stay tuned. Subscribe to our blog for more updates on coronavirus and its mark on the economy.