Streaming is one industry that hasn’t suffered under the “unprecedented times” brought on by the pandemic. In fact, audiences are streaming more content than ever.
The increase in streaming is coupled with changes in OTT advertising.
MediaRadar will soon be launching a new capability—OTT & TV Anywhere. With this new data, you can access advertising data across OTT channels.
This is the first of our blog posts with a sampling of this data. This first blog post uses data from only four OTT channels. In future blog posts, we will use data from across more channels to highlight consumer advertising trends in the OTT landscape.
We encourage you to subscribe to our blog for the latest data surrounding the advertising industry. We will provide daily updates as COVID-19 continues to make its mark on the US economy.

Streaming Audiences Grow in the Competitive Landscape
The end of 2020 marks the end of an era—the end of the introduction of new streaming platforms, at least for the foreseeable future. Now Netflix, Amazon Prime, and Hulu are joined by Quibi, Peacock, Disney+, Apple TV+, and HBO Max, and the playing field is set.
The field, however, is crowded. With about 75% of American consumers unwilling to pay more than $30 per month for streamed content, it seems likely that users will select their platforms of choice primarily based on the type of content available and pricing.
At the same time, overall streaming time has increased across the board. On average, U.S. consumers will spend more than 62 minutes per day streaming online content, which is a 23% increase from 2019 year-over-year (YoY). From 2018 to 2019, average streaming time only increased by 15%.
More than half of all viewers attribute this increase, at least in part, to stay‐at‐home orders. The addition of new streaming platforms could also be driving more streaming, as new or different content becomes available.
As Competition Fuels Changes in Streaming, Advertising Tags Along
The surge in OTT viewership is important for advertisers. By some estimates, brands can miss out on up to 40% of their target audience by neglecting to advertise on OTT platforms.
As early as the beginning of this year, streaming platforms were trying out new types of advertising space that didn’t involve forcing commercial breaks into streamed content. These included ideas such as:
- Static image ads displayed when shows were paused on Hulu.
- AI‐fueled product placement.
- Stranger Things‐themed ice cream flavors at Baskin‐Robbins.
Other streaming services, such as HBO Max, plan to stick with traditional video ads, though limited to older and less popular content.
In Q2 alone, the prevalence of streaming platforms caused a 31% YoY increase in ad revenue, a bright spot in a dulled market as the pandemic began to take root in the US.
Whether via product placement or commercial breaks, it’s clear that advertisers will have to keep up with ad spaces in OTT content if they want to reach a larger audience. As different platforms provide different opportunities for ads, it’s likely the scene will continue to change to stay competitive and relevant.
MediaRadar Insights
Methodology
The data used here comes from a sample dataset of just four OTTchannels. When OTT & TV Anywhere launches, there will be data from 23 channels available, with more added in 2021.
Findings
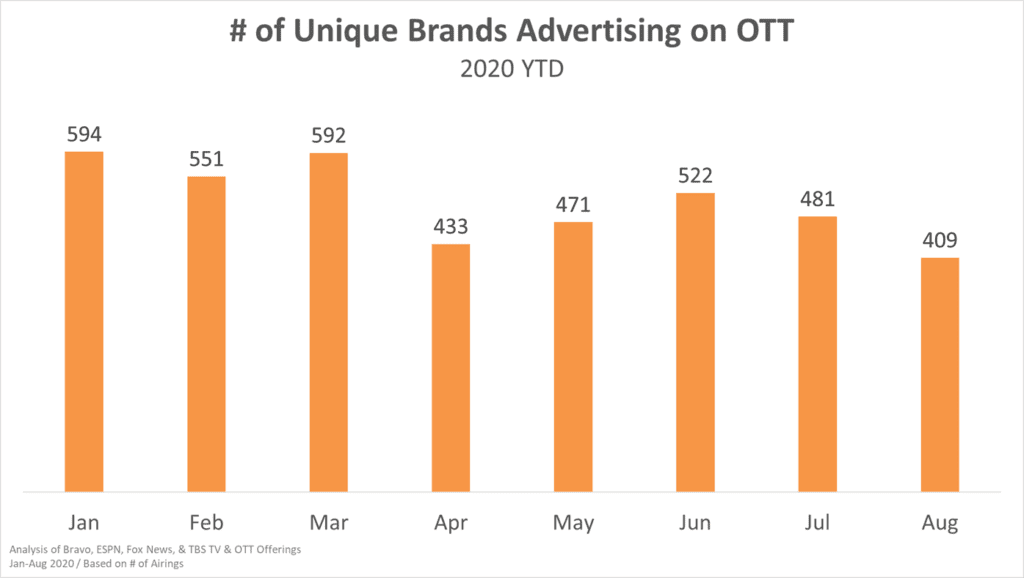
Across the sampling of four OTT channels, we saw over 400 unique advertisers every month this year. Q1 saw the most advertisers, with a drop in advertisers starting in April (the first full month after the pandemic became a national emergency).
Advertisers began to return, but then began to decrease again when cases surged in the summer. However, this is less indicative of the pandemic’s effect—those months are typically the slowest months of the year for advertising.
When we look at OTT advertisers, they typically choose one ad format per network or publication. For example, only 39% of OTT advertisers are also on a network’s linear TV program. If someone is seen on ESPN’s OTT offering, there is only a 39% chance they also advertise on ESPN in network television.
Across websites, there’s even less overlap. Only 19% of OTT buyers are seen on the providers’ website (i.e. only 19% of the advertisers on ESPN’s OTT offering are also seen advertising on ESPN.com)
Even though brands typically choose one format, there is overlap in the types of buyers who make up OTT and TV advertising.
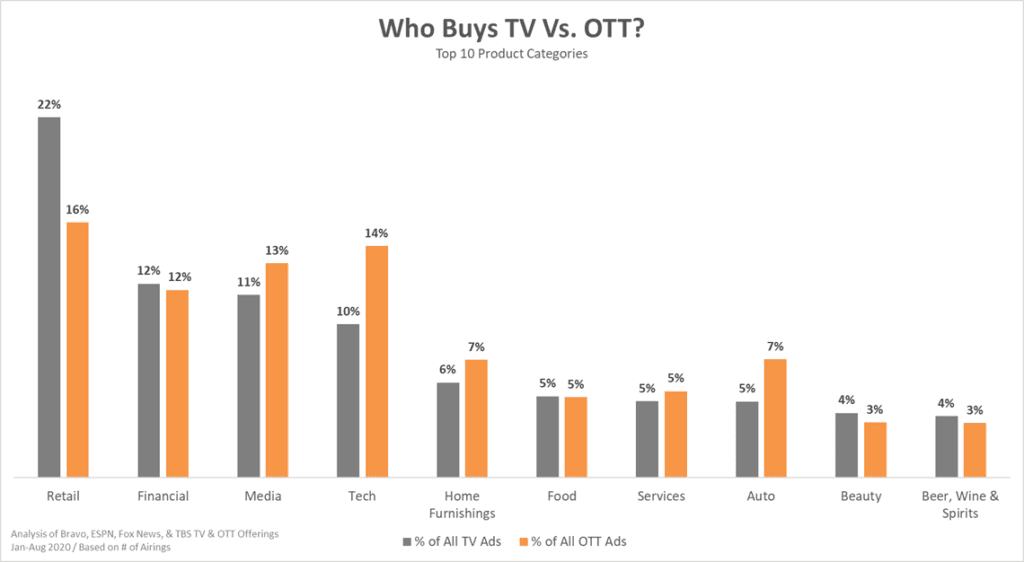
In fact, both of the top 4 categories of both categories make up 55% of the ads. In OTT, however, the ads are more evenly distributed across platforms. Retail continues to make up a more significant portion of all TV ads than OTT.
OTT presents new opportunities for the advertising industry and it’s important for leaders to stay informed. MediaRadar’s OTT & TV Anywhere can help. In the upcoming weeks, we’ll be sharing noteworthy trends and highlights from our new data offering.
For more updates like this, stay tuned. Subscribe to our blog for more updates on coronavirus and its mark on the economy.